API and Web Services
Once a model has been developed and validated using the IPL VS Code Plugin it can be submitted for analysis using Imandra.
You can submit models via the web interface or by using the command line interface as descibed below.
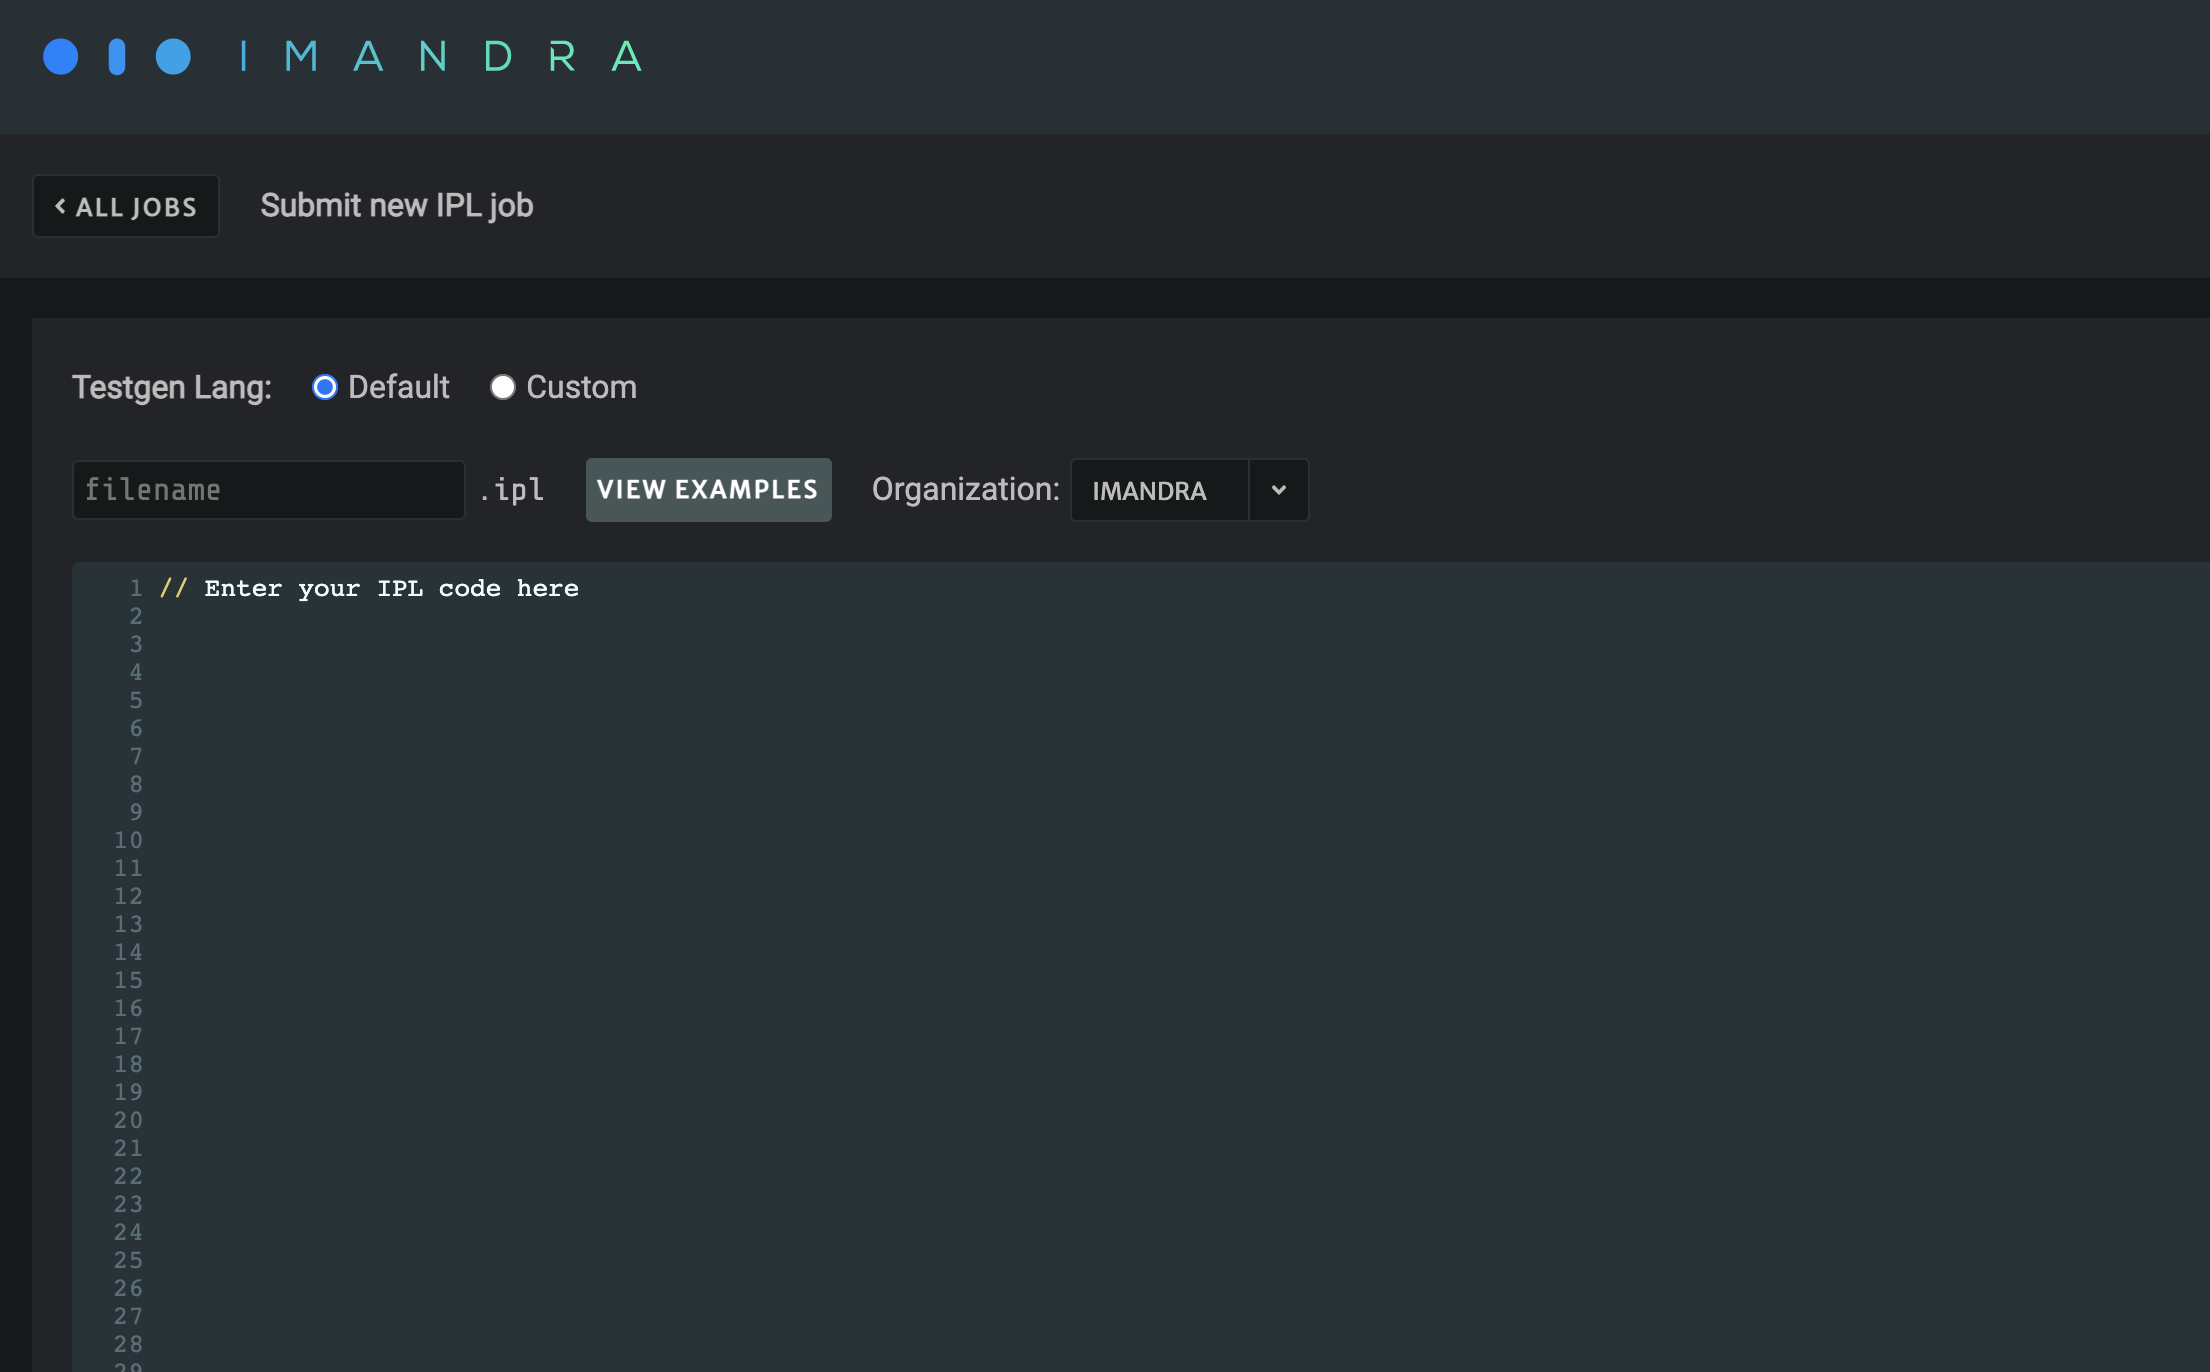
The web interface is available at https://www.imandra.ai/ipl/:
Command Line Interface
You’ll need the imandra CLI installed, as per the start of the Imandra installation instructions.
For an IPL file model.ipl, you can submit a file for analysis using:
imandra ipl decompose --file model.ipl --lang ipl

This returns a link to your job in the IPL UI so you can view the progress and results of your job.
Optionally adding a --testgen-lang argument will produce interpretable scripts for onboarding testing:
imandra ipl decompose --file ocx.ipl --testgen-lang imandra-test-script
This will produce scripts consumable by the imandra onboarding and connectivity tool.
The status of a submitted job can be checked given its job uuid:
imandra ipl status --uuid 44528ecc-13f9-492e-89e6-c751a92ff03f
Once this is complete, the data can be downloaded using:
imandra ipl data --uuid 44528ecc-13f9-492e-89e6-c751a92ff03f
You can view a list of your submitted jobs using:
imandra ipl list-jobs
Overview
An overview page is available giving you a summary of the different message flows specified in the IPL file, as well as the various expanded values for any field expanders:
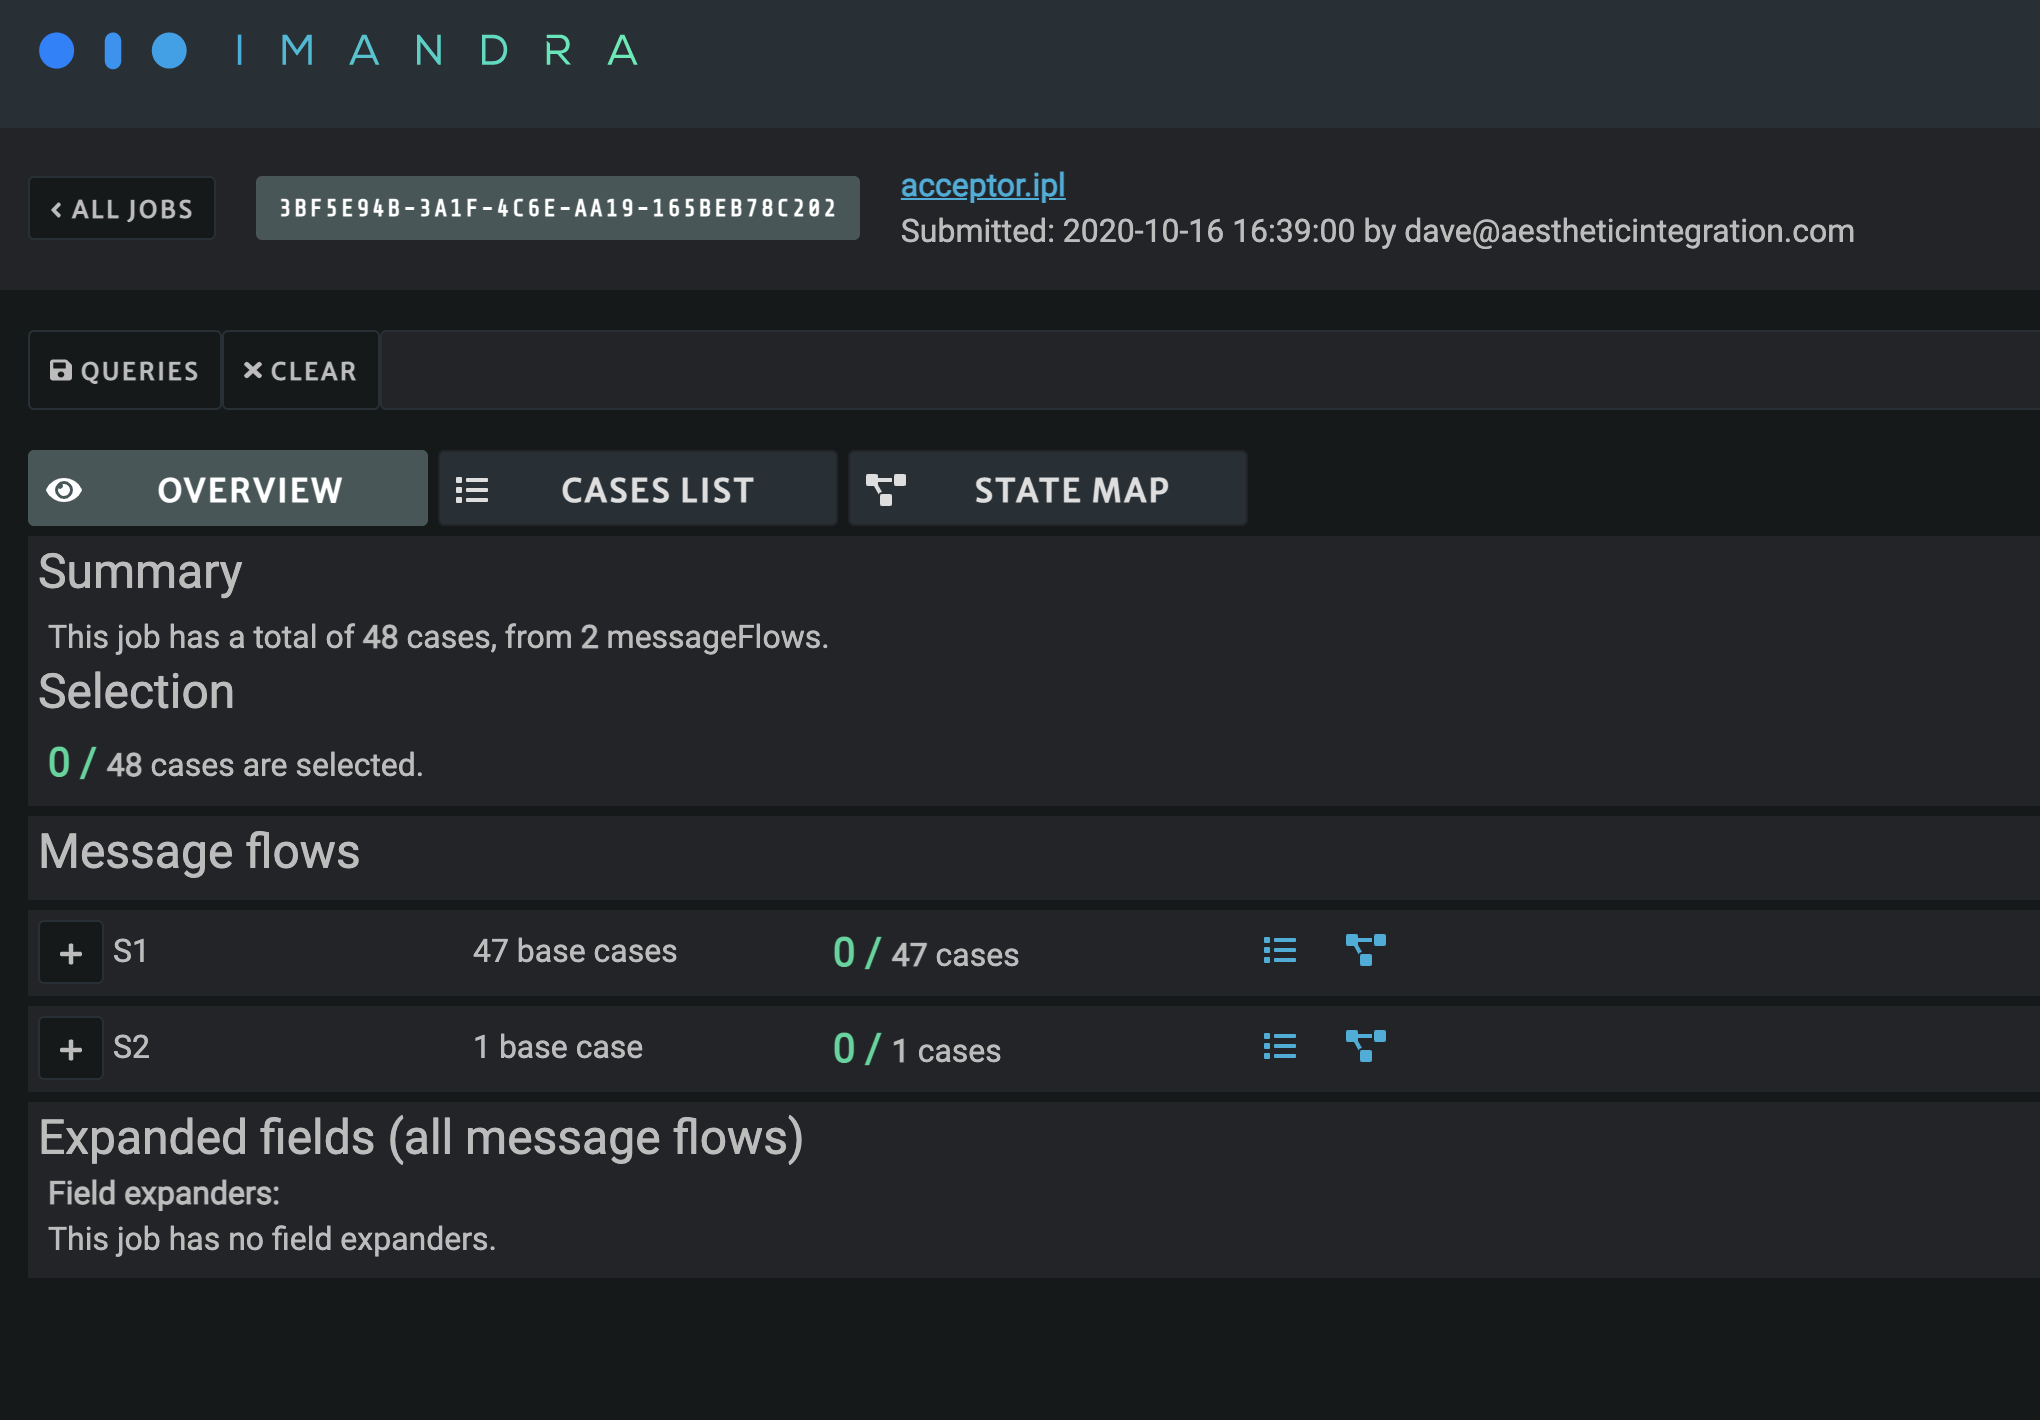
You can also see a summary of selected cases for each scenario and expander value.
The blue icons allow you to filter the list and state-map views down to a particular scenario or expander value using the UI’s graph query language.
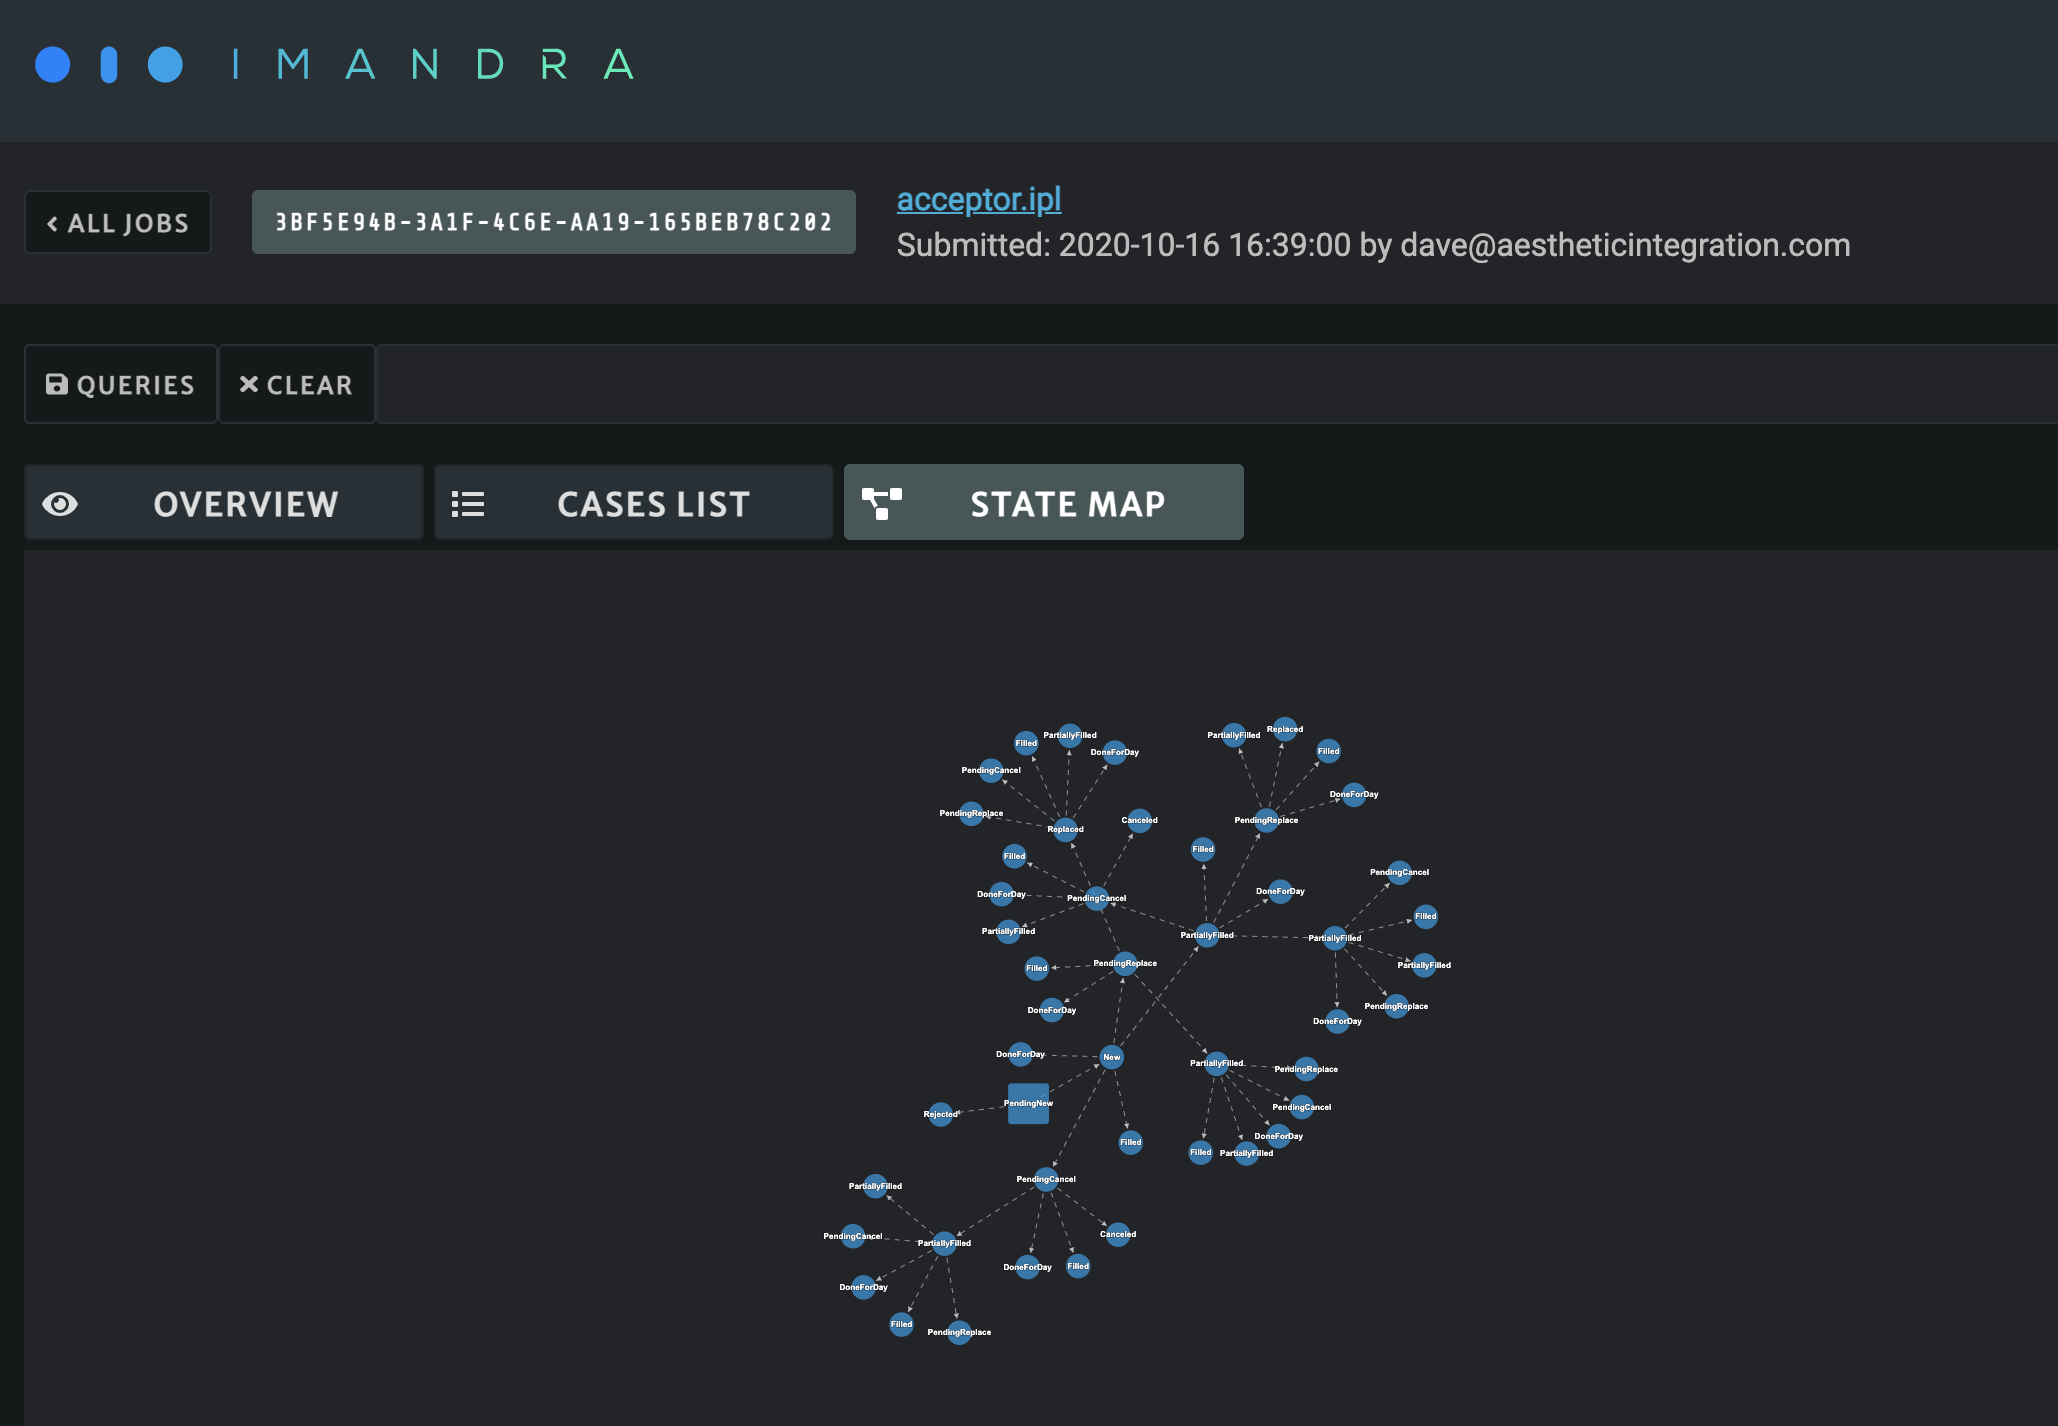
State Map
The state map gives a visual representation of the regions produced by Imandra.
- The square node is the ‘root’ representing the initial state of the venue, which is where Imandra begins analysis.
- Each edge between two nodes represents an event (a message or action from a message flow template).
- Subsequent nodes represent a state of the venue after the event leading into it.
Each edge and node shown in the state map has been determined as logically consistent with the model defined in the IPL file which was submitted as part of the job.
Cases List
A case in the cases list is produced for each node in the state map. A case is comprised of the sequence of events and states which leading up to the node which defines the case.
Some nodes and edges may occur in more than one message flow if different message flows have overlapping templates. When this occurs, the state-map view only contains one node, but the cases list will contain multiple cases, one for each message flow that describes the node’s behavior - this helps make it easier to query for cases based on particular message flows.
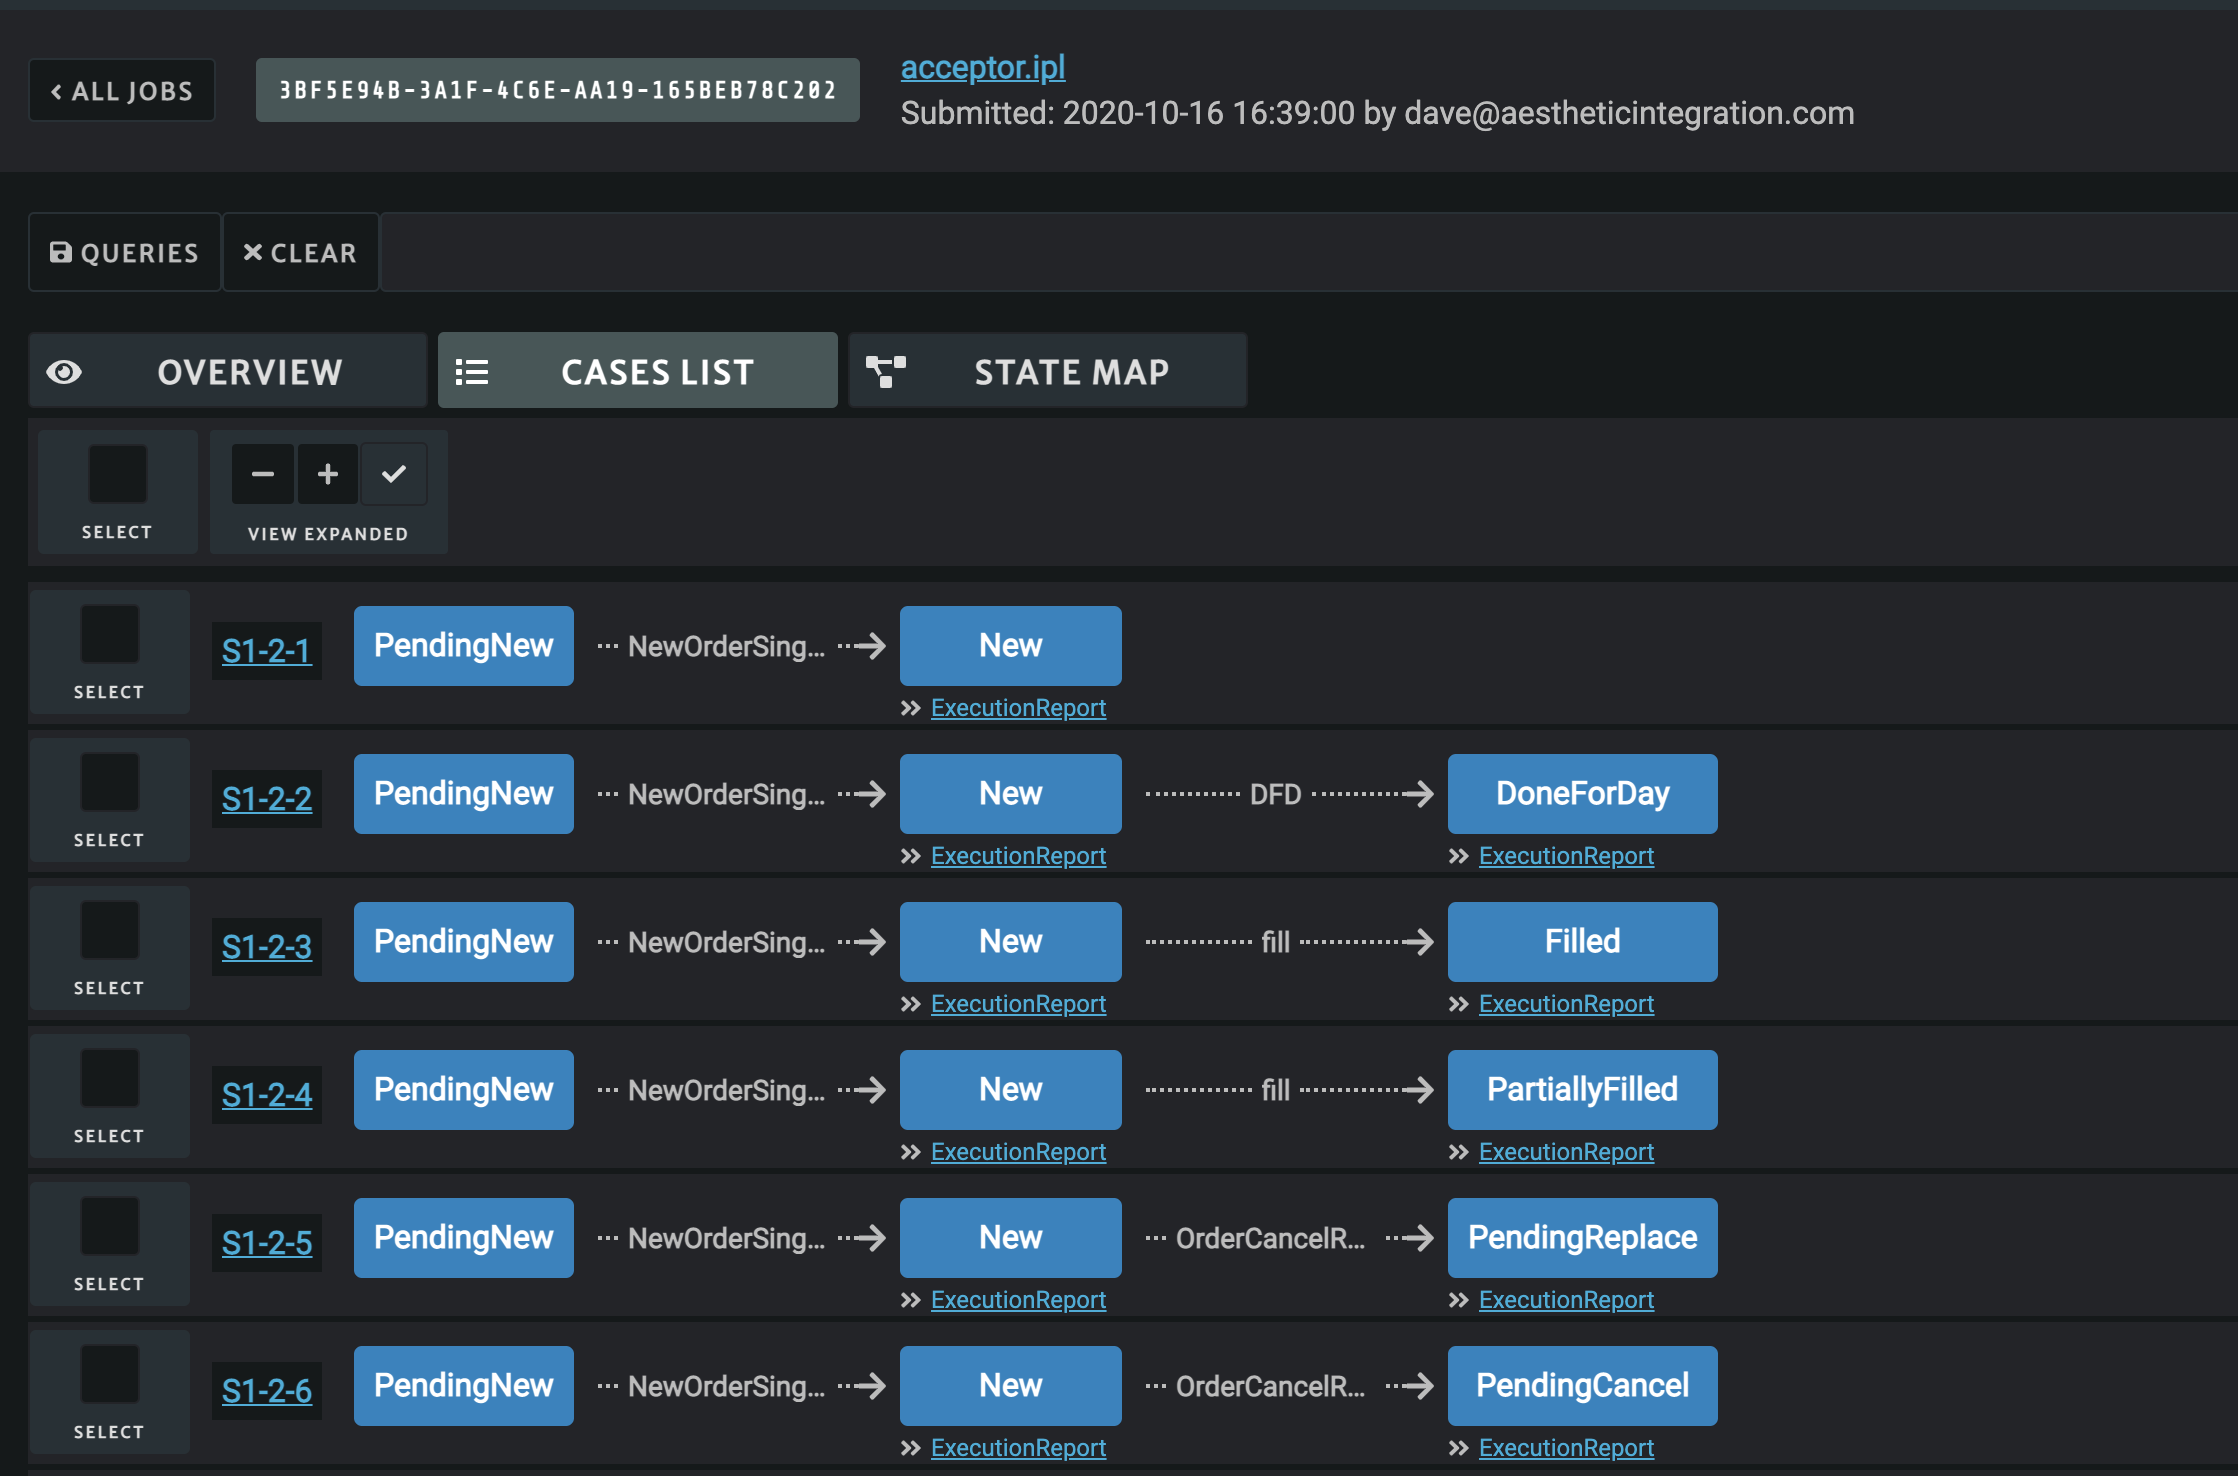
You can click on the case name at the start of each case row in the list. This will show you a list of sample points (concrete values that satisfy the logical constraints on the events and states of the case) for the case’s path.
If your job specification included any code-generation, the generated code will also be displayed here.
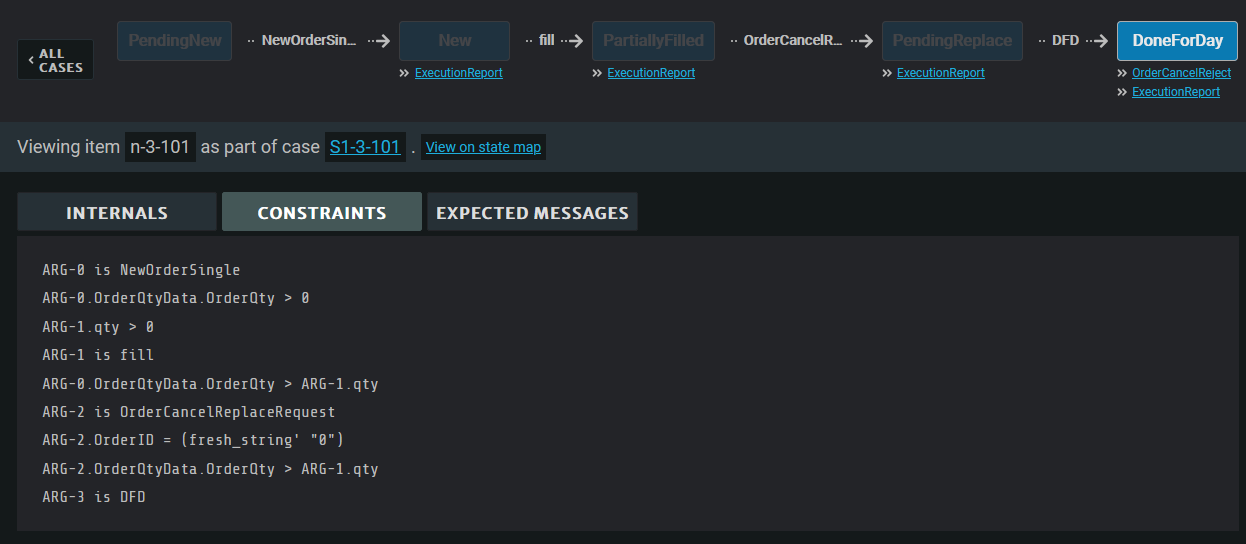
You can also click on individual nodes to view the symbolic constraints on the messages leading up to that node, as well as symbolic values for the state at that node:
Queries
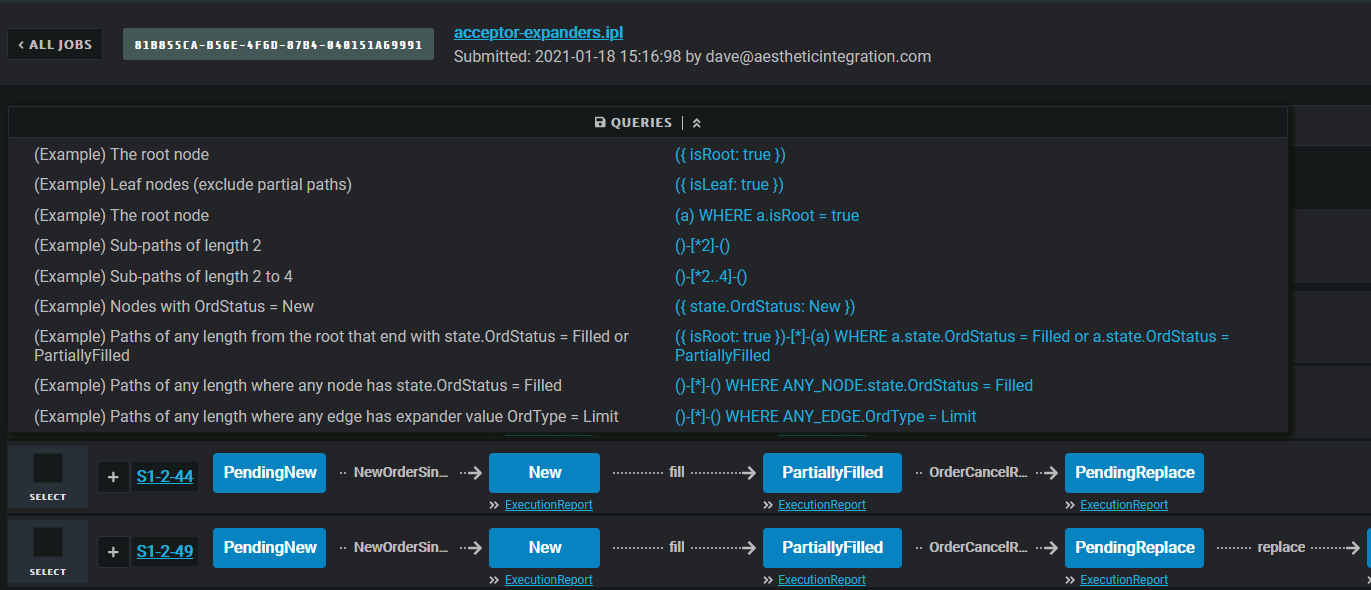
You can run queries against the graph using the queries bar at the top. We’ve provided some example queries in the queries button next to the bar to give you an idea of the kind of queries you can run:
The query language is loosely based on openCypher, and allows you to pattern match on paths through the state map. Nodes in the graph are specified by () and edges are specified by -[]-. Each path pattern must start and end with a node ().
If you’re browsing a job that you submitted, you can save queries of interest from within the queries button, so that other users can see the results of queries you’ve written easily.